

Getting to Know PUBG Mobile’s DS Performance Testing Tool
What Exactly is This DS Performance Thing?
Here’s the deal: the DS Performance Testing Tool is basically PUBG Mobile’s built-in detective for performance issues. Think of it as having a mechanic under the hood of your game, constantly checking what’s working and what’s not. Unlike those basic FPS counters that just tell you yep, your frames are dropping, this tool digs deeper—tracking CPU cores individually, monitoring how your GPU handles all those fancy graphics, and even keeping tabs on your memory usage patterns.
The really cool part? It’s collecting data every few milliseconds while you play. So when you’re in the middle of a heated firefight in Pochinki and suddenly everything turns into a slideshow, the DS tool knows exactly when and why it happened. Whether it’s your device choking on vehicle physics or struggling with those gorgeous (but demanding) HDR textures, this tool catches it all.
Now, while you’re optimizing performance, don’t forget that having enough UC can unlock premium features that actually help with gameplay quality. BitTopup’s got your back with competitive rates and instant delivery—check out our PUBG Mobile UC top up guide for hassle-free account enhancement.
Key Features That Actually Matter
The DS tool isn’t just throwing numbers at you—it’s organized into modules that work together like a well-oiled machine. The FPS monitoring system uses a traffic light approach: green means you’re cruising above 55 FPS (sweet spot for most players), yellow indicates you’re in that 40-55 FPS zone where things feel a bit choppy, and red? Well, red means you’re below 40 FPS and probably getting knocked by players you can’t even see properly.
But here’s where it gets interesting—the CPU monitoring doesn’t just show overall usage. It breaks down individual core performance, spots thermal throttling before your device turns into a hand warmer, and tracks frequency scaling. Your GPU analysis includes rendering loads, memory tracking, and if you’re running Android 8.0+ with Vulkan support, you’ll get specific Vulkan performance data. (Pro tip: Vulkan usually runs more efficiently than OpenGL, so it’s worth checking if your device supports it.)
The memory monitoring is particularly clever—it tracks both your system RAM and graphics memory, which helps identify those annoying memory leaks that cause stuttering after extended play sessions.
What’s New in Version 4.0?
PUBG Mobile’s 4.0 update didn’t just add new content—it seriously upgraded the DS Performance Tool. The biggest game-changer? Support for 120 FPS monitoring. If you’ve got one of those fancy gaming phones with 120Hz or 144Hz displays, the tool now tracks performance accurately at those higher refresh rates.
The network diagnostics got a major boost too. We’re talking packet loss detection, server response analysis, and connection stability metrics that help you figure out if your lag is actually network-related or if your device is just struggling to keep up.
Here’s something I find particularly useful: thermal management integration. The 4.0 update correlates device temperature with performance metrics in real-time. This is huge for understanding why your performance tanks after 20 minutes of intense gameplay—spoiler alert, it’s usually your phone getting too hot and automatically throttling performance to prevent damage.
Actually Getting the DS Tool Working
The Step-by-Step Unlock Process
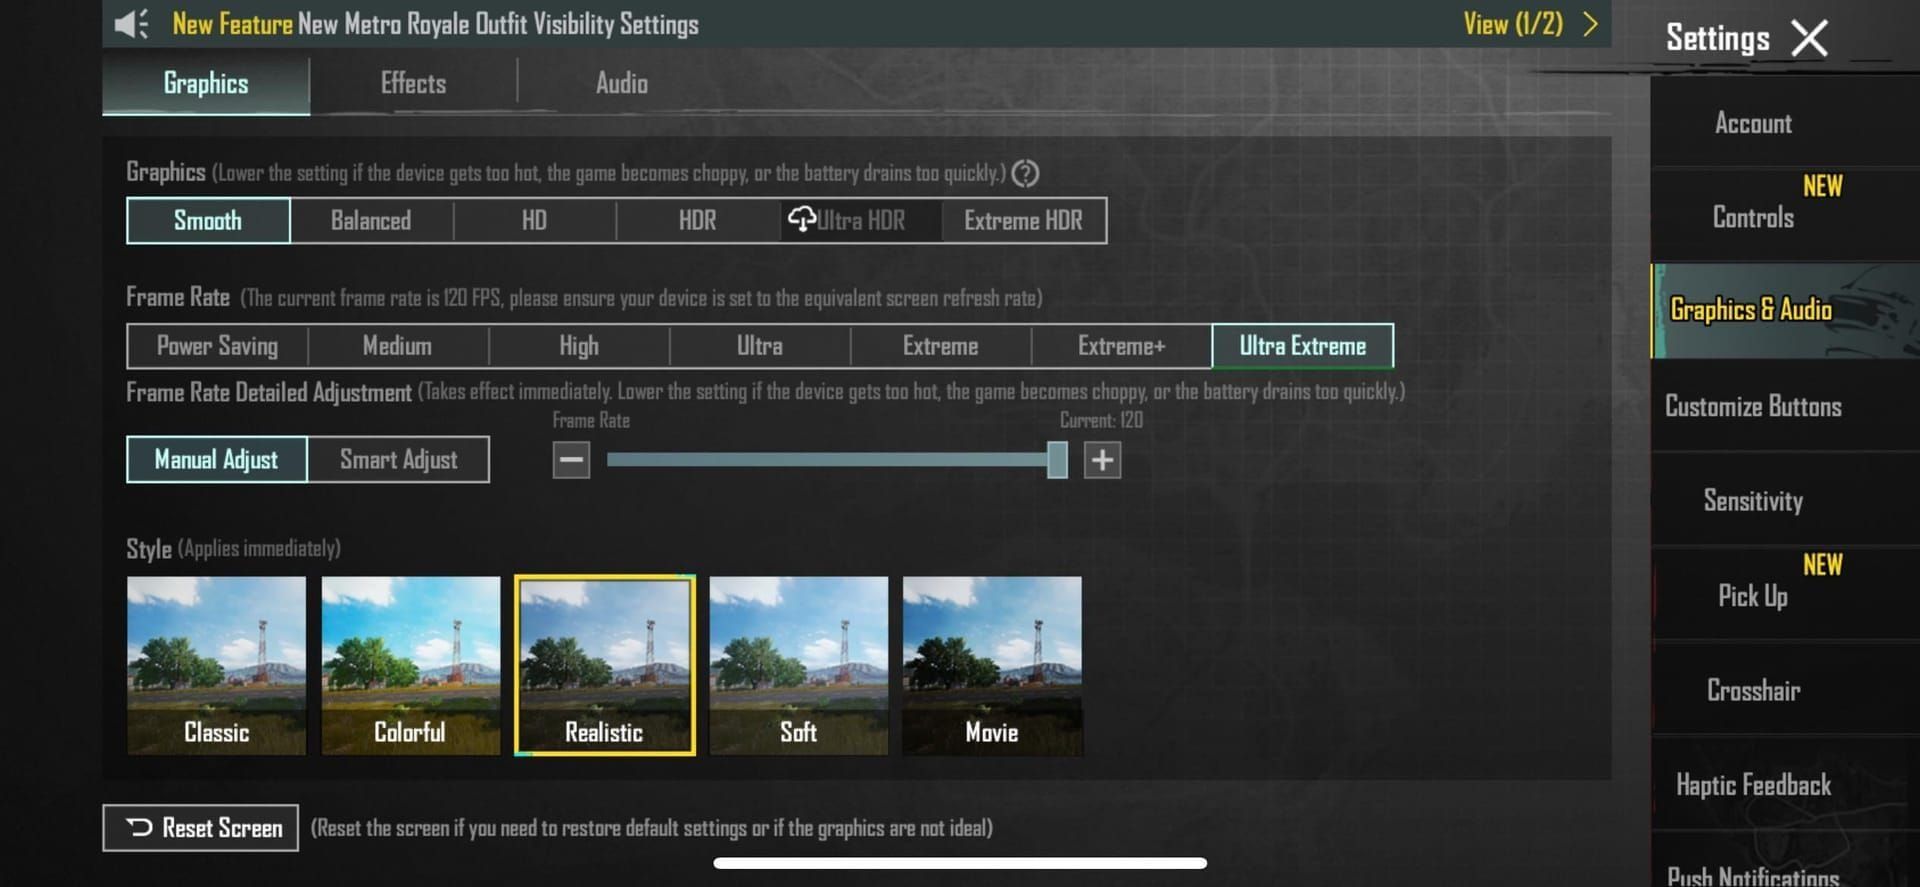
Alright, let’s get this thing enabled. Fire up PUBG Mobile and hit that gear icon in the main lobby—you know, the settings button. Navigate to the Graphics section and scroll all the way down to where the advanced stuff lives.
Here’s the slightly weird part: you need to tap the About section seven times in a row, and you’ve got 10 seconds to do it. Yeah, it feels like you’re entering a cheat code from the '90s, but that’s how you unlock developer options. Once you nail the sequence, a shiny new Performance tab appears in your settings menu.
Click Enable Performance Monitoring and choose how you want the data displayed. I personally prefer the overlay mode—it keeps everything visible without being too intrusive. You can also pick your data collection frequency here. High-frequency monitoring (every 100ms) gives you incredibly detailed data but might drain your battery faster. Standard monitoring (every 500ms) works fine for most diagnostic needs.
Device Compatibility—Will Your Phone Play Nice?
Not all devices are created equal when it comes to DS tool support. For Android users, you’ll need Android 7.0 or higher with at least 4GB of RAM for the full experience. Technically, it’ll work with 3GB RAM, but you might miss some features.
iOS folks need iOS 12.0 or later with an A10 Bionic processor or newer. Anything older and you’re probably better off focusing on basic optimization rather than detailed diagnostics.
Gaming phones get special treatment here. ASUS ROG Phone series devices integrate beautifully with the DS tool through Armoury Crate, giving you hardware-level monitoring that goes beyond what standard phones can offer. OnePlus devices with Game Space show improved DS tool performance, and Samsung Galaxy phones benefit from Game Booster compatibility.
Storage-wise, make sure you’ve got at least 500MB free for performance logging. The tool creates temporary files and logs data, so cramped storage will limit its effectiveness.
When Things Don’t Work (Troubleshooting Time)
Sometimes the developer options just won’t show up, even after you’ve tapped About until your finger hurts. Samsung device users should try accessing through Game Launcher settings instead. Xiaomi users might need to enable permissions through the Security app—yeah, it’s a bit convoluted.
Permission issues are probably the most common roadblock. Head to your device’s App Permissions settings and make sure PUBG Mobile has access to system performance data, overlay permissions, and background activity monitoring. Some phones require you to manually grant each permission individually, which is annoying but necessary.
Speaking of optimization—while you’re troubleshooting, maintaining adequate UC balance ensures you can access premium features that enhance gameplay quality. BitTopup’s streamlined PUBG Mobile UC recharge step by step process means you won’t miss out on optimization opportunities while you’re getting your performance monitoring sorted.
Decoding the DS Tool Interface
Real-time Performance Indicators That Actually Help
The DS tool interface is designed to give you immediate feedback without blocking your view of enemies trying to third-party you. The main FPS indicator shows your current frame rate plus a rolling 5-second average—this helps distinguish between brief hiccups and sustained performance problems.
Those color codes I mentioned earlier? They’re not just pretty—they provide instant visual feedback that you can process even during intense gameplay. Consistent green means you’re golden. Intermittent yellow suggests your device is working hard but managing. Red warnings mean it’s time to either adjust settings or accept that you’re at a disadvantage.
The performance trend graphs are where things get really interesting. They show historical data from your current session, revealing patterns across different scenarios. You might notice your FPS is rock-solid in open areas but tanks every time you enter buildings, or that performance gradually degrades over time (hello, thermal throttling).
FPS Monitoring That Goes Beyond Basic Numbers
The FPS monitoring system offers multiple display modes depending on how deep you want to dive. Detailed mode shows current FPS, minimum FPS over the past minute, maximum achieved, and session average. But here’s the really useful part: frame time analysis.
Frame time measures how long each frame takes to render in milliseconds. Consistent frame times below 16.67ms indicate smooth 60 FPS performance. When frame times start fluctuating wildly, that’s when gameplay feels stuttery even if your average FPS looks decent.
The tool also tracks performance percentiles—specifically 1% low and 0.1% low FPS values. These represent your worst performance moments, which often have a bigger impact on gameplay experience than average FPS. You might average 55 FPS but if your 1% low is 25 FPS, those drops will be very noticeable during crucial moments.
CPU and GPU Metrics That Tell the Real Story
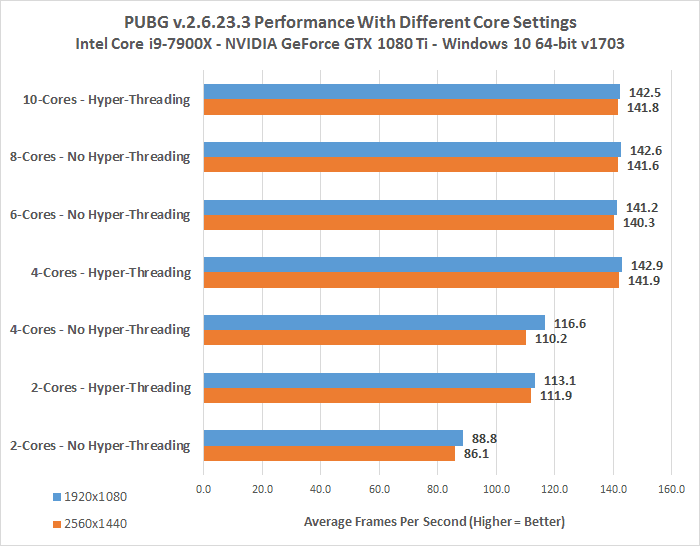
CPU monitoring breaks down processor utilization across individual cores, which is incredibly useful for understanding whether your device is actually using all available processing power efficiently. Many mobile games still rely heavily on single-core performance, so you might see one core maxed out while others sit relatively idle.
The thermal monitoring integration shows CPU and GPU temperatures when your device sensors allow access. This is crucial for understanding thermal throttling—when your device gets too hot and automatically reduces performance to prevent damage. You’ll see a characteristic pattern where performance starts strong but gradually decreases as temperatures rise.
GPU metrics include rendering pipeline utilization and graphics memory usage. Graphics memory monitoring is particularly important for devices with limited VRAM. When high-resolution textures or complex effects exceed available memory, you get stuttering that’s distinctly different from CPU or thermal issues.
Diagnosing Those Annoying FPS Drops
Finding the Real Culprit Behind Performance Issues
Performance bottleneck identification is like being a detective—you need to look at all the evidence to figure out what’s actually causing problems. CPU bottlenecks typically show high CPU utilization (above 80%) while GPU usage remains moderate. This means your graphics processor is waiting around for the CPU to finish calculations.
GPU bottlenecks present the opposite pattern: high graphics utilization (above 90%) with moderate CPU usage. This suggests your graphics settings are too ambitious for your device’s rendering capabilities.
Memory bottlenecks are trickier to spot but show as high RAM usage (above 85%) accompanied by periodic stuttering. These stutters happen when the system runs garbage collection to free up memory. Thermal bottlenecks have a distinctive signature—performance starts great but gradually degrades over 10-15 minutes as your device heats up and protective throttling kicks in.
Network Problems vs Hardware Limitations
Here’s something that trips up a lot of players: assuming all performance issues are hardware-related. Network problems can definitely impact your gameplay experience, but they show different patterns in the DS tool. Network issues typically manifest as high ping (above 100ms), packet loss indicators, or connection warnings while your FPS and system resources remain stable.
Hardware issues show consistent patterns regardless of network conditions. If your FPS drops every time you enter Pochinki whether you’re playing solo or in a crowded lobby, that’s hardware. If performance varies dramatically based on server load or time of day, network issues are more likely.
Mixed scenarios are common too—devices with insufficient processing power often struggle more when managing both graphics rendering and network communication simultaneously.
Map-Specific Performance Patterns
Different maps stress your device in different ways, and the DS tool reveals these patterns clearly. Erangel and Miramar generally provide the most stable performance because they have simpler environmental geometry and fewer dynamic elements. Sanhok and Vikendi are more demanding due to dense vegetation, complex lighting, and weather effects that stress both CPU and GPU.

Urban areas consistently show performance impacts across all maps. Complex building geometry, multiple texture layers, and the possibility of multiple players in close proximity all contribute to increased performance demands. The DS tool typically records lower FPS in major cities compared to rural areas—this is completely normal and expected.
Your Step-by-Step FPS Drop Diagnosis Workflow
Setting Up for Accurate Testing
Effective diagnosis starts with establishing clean baseline measurements. Close all background apps, make sure your device has adequate charge (above 50% to prevent power management interference), and enable the DS tool with high-frequency monitoring.
Spend 5 minutes in the training ground doing standard activities: moving around, aiming, shooting, and cycling through scopes. Record your average FPS, CPU usage patterns, and initial device temperature during this controlled phase. This baseline helps you identify when performance deviates from normal during actual gameplay.
Configure your graphics settings to match your typical gameplay preferences before starting diagnostic testing. There’s no point testing on Smooth graphics if you normally play on HDR—the performance characteristics will be completely different.
Structured In-Game Testing
Systematic testing requires hitting different performance stress points while maintaining consistent DS tool monitoring. Start each session by landing in low-complexity areas to establish stable performance, then progressively move to more demanding environments.
Combat testing involves actively seeking firefights while monitoring FPS stability and resource usage spikes. Vehicle testing stresses different systems through rapid environmental transitions and physics calculations. Drive across various terrain types and note any FPS drops during high-speed movement or map transitions.
The key is consistency—test the same scenarios multiple times to identify patterns rather than one-off anomalies.
Making Sense of Your Data
Comprehensive data collection means recording DS tool metrics across multiple gaming sessions to identify consistent patterns. Create simple performance logs documenting FPS ranges, resource peaks, and thermal behavior under different conditions.
Look for correlation patterns in your data. High CPU usage combined with moderate GPU utilization suggests CPU bottlenecks. The reverse pattern indicates graphics limitations. Gradual FPS degradation over time with rising temperatures clearly points to thermal throttling.
Reading DS Tool Data Like a Pro
Understanding Normal vs Problematic FPS Patterns
Healthy FPS patterns show minor fluctuations (±5 FPS) around target frame rates with occasional brief drops during intensive scenes. This is normal—no device maintains perfectly consistent performance under varying loads.
Problematic patterns include sustained drops below 45 FPS, erratic fluctuations exceeding ±15 FPS, or progressive degradation over gaming sessions. Periodic FPS drops at regular intervals often indicate background system processes interfering with game performance.
Combat-related FPS drops show characteristic patterns during firefights, with performance typically recovering quickly after engagements end. If recovery takes more than a few seconds, you’re likely dealing with thermal or memory issues rather than normal combat stress.
Critical Performance Thresholds You Need to Know
Minimum acceptable FPS for competitive play ranges from 45-50 FPS, with optimal performance requiring sustained 60 FPS or higher. CPU utilization consistently above 85% across multiple cores indicates processing bottlenecks. GPU utilization above 90% means your graphics settings exceed device capabilities.
Temperature thresholds vary by device, but thermal throttling typically begins around 70°C for sustained operation. Some gaming phones can handle higher temperatures, but most standard smartphones start reducing performance at this point.
Connecting Metrics to Actual Gameplay Experience
High FPS numbers don’t guarantee smooth gameplay if frame time consistency suffers. Consistent frame times below 16.67ms provide smooth 60 FPS experience, while fluctuating frame times cause perceived stuttering even with acceptable average FPS.
Input lag correlation with performance metrics helps identify responsiveness issues that impact competitive gameplay. Visual quality correlation with performance data guides optimization decisions by showing the actual performance cost of specific graphics settings.
Common PUBG Mobile 4.0 Performance Headaches
Update-Related FPS Problems
PUBG Mobile’s 4.0 update introduced several performance challenges that weren’t present in previous versions. New rendering optimizations sometimes conflict with older device drivers, causing FPS instability that the DS tool helps identify.
Memory management changes in version 4.0 affect devices with limited RAM more severely, causing frequent garbage collection events that manifest as periodic stuttering. Graphics API updates provide improved Vulkan support but may cause compatibility issues on devices with older graphics drivers.
New Features Eating Your Performance
Version 4.0’s enhanced visual effects and gameplay mechanics introduce additional performance overhead. Advanced lighting systems stress GPU rendering capabilities, with the DS tool showing increased graphics memory usage even at equivalent quality settings compared to previous versions.
New particle effects and environmental details increase CPU processing requirements for physics calculations. Enhanced audio processing and spatial sound features add CPU overhead that compounds with graphics processing demands—your device is working harder even if settings appear identical to version 3.x.
Device-Specific 4.0 Compatibility Issues
Certain device models experience specific compatibility issues with version 4.0. Older Snapdragon 660 and 665 processors show more aggressive thermal throttling in 4.0. MediaTek devices, particularly Helio G series processors, experience memory management issues that cause periodic stuttering during map transitions.
iOS devices with A12 Bionic processors or older sometimes experience frame pacing issues in 4.0 that cause perceived stuttering despite maintaining target FPS. The DS tool helps identify these device-specific patterns.
Optimization Solutions Based on What the DS Tool Tells You
Graphics Settings Adjustments That Actually Work
DS tool analysis guides targeted graphics optimization by revealing which visual features most significantly impact your specific device. When GPU utilization consistently exceeds 90%, systematic graphics reduction provides the most effective improvements.
Start by reducing graphics quality from HDR to Balanced or Smooth—this typically decreases GPU load by 20-30% while maintaining competitive visibility. Shadow settings provide significant performance gains when disabled or reduced, with the DS tool showing GPU utilization drops of 15-25% on most devices.
Frame rate settings should target the highest stable option your device supports. The DS tool helps identify sustainable targets through extended testing rather than guessing.
Background App Management Based on Real Data
Effective background app management requires identifying specific applications that interfere with PUBG Mobile performance. Social media apps, streaming services, and automatic update processes consume CPU and memory resources that impact gaming.
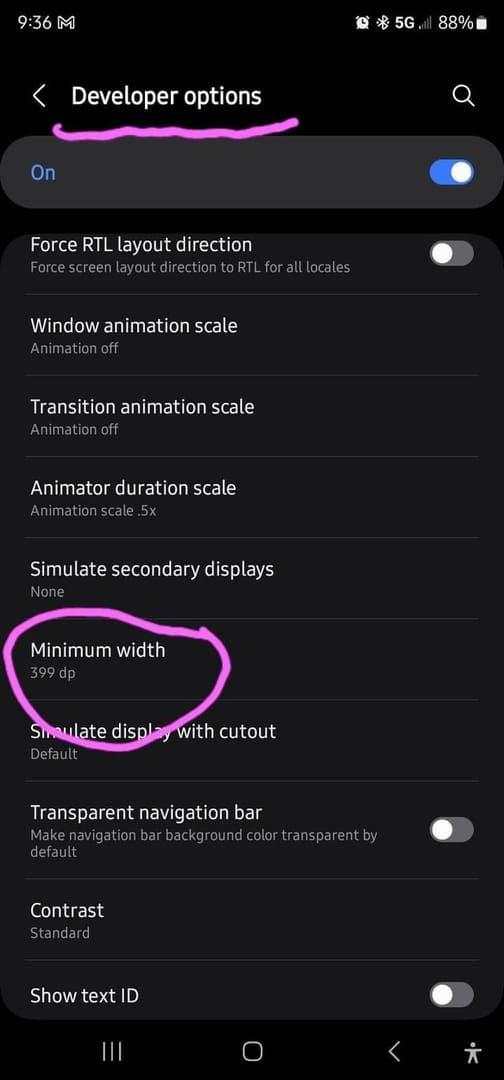
Android Developer Options provide powerful background process management tools. Limiting background processes to 2-3 applications frees system resources for gaming. System-level optimizations include disabling automatic updates, reducing notification frequency, and configuring power management for maximum performance.
Device-Specific Optimization Strategies
Gaming smartphones offer advanced optimization features that complement DS tool analysis. ASUS ROG Phone series Armoury Crate X Mode provides system-level performance enhancements with customizable CPU and GPU frequency profiles.
OnePlus devices benefit from Game Space optimization features that prioritize gaming performance and reduce background interference. Samsung Galaxy devices with Game Booster integration offer performance optimization specifically designed for gaming applications.
Advanced DS Tool Usage and Pro Tips
Competitive Gaming Performance Standards
Competitive PUBG Mobile requires maintaining specific performance thresholds that the DS tool helps monitor consistently. Professional players typically target sustained 60 FPS with frame time consistency below 16.67ms and input lag under 40ms.
Performance consistency proves more important than peak performance for competitive play. Minimum FPS values should remain above 50 FPS even during intensive combat scenarios. Device temperature management becomes crucial for competitive sessions lasting multiple hours.
Long-term Performance Monitoring
Extended DS tool monitoring reveals performance trends that short-term testing misses. Weekly performance logging helps identify gradual decreases due to software updates, background app accumulation, or device aging effects.
Storage space management affects long-term performance as devices approach capacity limits. Battery health monitoring becomes important as battery degradation affects power management and thermal characteristics over time.
Integration with Other Optimization Tools
Third-party optimization tools can complement DS tool analysis when used carefully. GFX tools provide graphics modifications beyond standard options, with the DS tool helping verify performance impact. System monitoring applications provide additional insights that complement DS tool gaming-specific metrics.
Performance benchmarking applications help establish device baselines and compare results with similar devices for context.
Frequently Asked Questions
What exactly is the DS Performance Testing Tool and how does it work? The DS Performance Testing Tool is PUBG Mobile’s integrated diagnostic system that monitors frame rates, CPU usage, GPU utilization, and system temperatures in real-time during gameplay. It collects performance data at millisecond intervals, creating detailed profiles of how your device handles different gaming scenarios.
How do I actually enable the DS Performance Tool in PUBG Mobile 4.0? Navigate to PUBG Mobile’s Settings > Graphics section and tap About seven times consecutively within 10 seconds to unlock developer options. A new Performance tab appears in settings where you can enable monitoring and configure display preferences.
Why is my PUBG Mobile FPS dropping after the 4.0 update? Version 4.0 introduced enhanced visual effects, improved lighting, and new gameplay mechanics that increase performance demands. The DS tool helps identify specific causes including GPU overutilization from enhanced graphics, increased CPU overhead from new physics, or memory management changes affecting limited RAM devices.
What do all these DS Performance Tool metrics actually mean? FPS metrics show current frame rate with color coding: green above 55 FPS, yellow 40-55 FPS, red below 40 FPS. CPU metrics display individual core usage, frequency scaling, and thermal throttling. GPU metrics include rendering loads, graphics memory usage, and API performance data.
Can the DS Performance Tool actually fix my lag issues? The DS tool diagnoses performance problems rather than directly fixing them. Based on findings, you can implement targeted solutions like graphics adjustments, background app management, thermal management, or network optimization.
What FPS should I aim for in competitive PUBG Mobile? Competitive play requires sustained 60 FPS with frame time consistency below 16.67ms for optimal aiming and movement timing. Minimum acceptable competitive performance ranges from 45-50 FPS, with professionals prioritizing consistency over peak FPS.